Suppose you’re writing a paper in LaTeX and want to make a quick diagram to include in your text.
Here you can do that.
To create a diagram, start by selecting one or (with Shift -click) more locations on the canvas below (if none is visible, you may need to zoom out or increase your screen size), and then click either the Node or the Contour button. To manipulate your diagram, you can drag nodes around, add labels to nodes, connect nodes with arrows, etc. When you’re done, click the Generate button to have the LaTeX code displayed in the text area below the canvas. To use that code in your document, you’ll need Peter Kabal’s TeXdraw package. (See below for a sample file and instructions for Overleaf users.) You can also load diagrams from previously generated code, using the Load button.
Keyboard commands
The following keyboard commands are available for editing the diagram displayed on the canvas. For editing the TeXdraw code in the text area, the usual commands (including Ctrl + Z and Ctrl + Y for ‘undo’ and ‘redo’) are also available. To select a single node out of a group, hold Ctrl pressed while clicking on it.
| Shortcut | Action |
|---|---|
| N | Add entity nodes at selected locations. |
| M | Add contours at selected locations. |
| X | Create abstractions of selected nodes: ‘ghost nodes’ that will transfer their own features onto any nodes they’re dragged onto. |
| C | Create copies of selected items. (This works not just with nodes, but also with labels.) Add new members to an existing group by copying individual members. |
| L | Attach a label to each selected node. |
| Space | Create one or more ‘dependent items’, such as labels or arrows, attached to the currently selected nodes. (Equivalent to clicking the Create button.) |
| Z | Undo. |
| Y | Redo. |
| W , ↑ | Move selection upwards. |
| A , ← | Move selection to the left. |
| S , ↓ | Move selection downwards. |
| D , → | Move selection to the right. |
| 1 | Set movement distance to 0.1 pixels. |
| 2 | Set movement distance to 1 pixel. |
| 3 | Set movement distance to 10 pixels. |
| 4 | Set movement distance to 100 pixels. |
| 5 | Decrease shading by 0.1. |
| 6 | Increase shading by 0.1 (maximum: 1). |
| 7 | Set shading to 0. |
| Shift + 7 | Set shading to 1. |
| 8 | Decrease linewidth by 0.1 pixels. |
| 9 | Increase linewidth by 0.1 pixels (maximum: 32 pixels). |
| 0 | Set linewidth to 0. |
| Shift + 0 | Set linewidth to 1 pixel. |
| F | Flip selection horizontally. |
| V | Flip selection vertically. |
| P | Turn selected contours into regular polygons. |
| Q | Rotate selection counter-clockwise by 45 degrees. |
| Shift + Q | Rotate selection counter-clockwise by 10n degrees, where n ranges from -1 to 2 (default: 0). The value of n can be set by using the keys 1 – 4 . |
| E | Rotate selection clockwise by 45 degrees. |
| Shift + E | Rotate selection clockwise by 10n degrees, where n ranges from -1 to 2 (default: 0). The value of n can be set by using the keys 1 – 4 . |
| R | Rotate selected contours clockwise by 180 / n degrees, where n is the number of nodes in the respective contour. (E.g., a contour with six nodes is rotated by 30 degrees.) |
| U | Decrease the scaling of the selection by 10n percentage points, where n ranges from -1 to 2 (default: 0). The value of 100% corresponds to the size of the selection—as measured by the distances between selected nodes—at the time it was initiated. Scaling is affected by the relevant options listed in the ‘Transform’ tab. |
| I | Increase the scaling of the selection by 10n percentage points, where n ranges from -1 to 2 (default: 0). The value of n can be set by using the keys 1 – 4 . |
| T | Round the location of each selected node to the nearest pixel. |
| G | Create a group that contains, for each selected item, either the item itself or the highest group among those with which the item is connected by a chain of active membership and that are such that all their ‘leaf members’ are among the selected items. (Maximum group level: 32.) |
| H | Deactivate the membership of each selected item or its second-highest ‘active’ group (where applicable) in its currently highest active group. |
| J | Reactivate the membership of each selected item or (where applicable) its highest active group in the next-lowest group. |
| K | Reactivate the membership of each member of each selected item’s highest active group. |
| , | Turn on ‘adding’. In this mode, selecting an item will add it (or its highest active group, where applicable) to the highest active group of the currently focused item. (This mode can be turned off by clicking on the canvas or by turning on ‘dissolve-adding’.) |
| . | Turn on ‘dissolve-adding’. In this mode, selecting a item will add all members of its highest active group (or the item itself, if there is no such group) to the highest active group of the currently focused item. |
| Delete , Backspace | Delete all selected items. |
| Shift + Space | Deselect any currently selected locations on the canvas. |
| Shift + Enter | Generate the TeXdraw code for the current diagram and display it in the text area below the canvas. |
| Ctrl + Enter | (Re)load diagram from the TeXdraw code shown in the text area below the canvas. |
Alternative apps
The following are a few other editors that also export LaTeX code:
- Dia, a desktop application specializing on diagrams, with a wide variety of export options.
- Inkscape, a fully-featured desktop SVG editor, also allows the creation of diagrams.
- Quiver, a powerful web-based editor that specializes on commutative diagrams.
- TpX, another desktop application, superficially similar to Dia.
Basic design features
- Simplicity. A diagram in pasi consists of at most three basic kinds of building block: entity nodes, contour nodes, and ornaments (such as labels). Their placement and other properties completely determine the appearance of a diagram.
- Precision. With the cursor keys (or W , A , S , D ), it is possible to position items to a precision of one-tenth of a pixel. The exact coordinates of an item can be inspected and adjusted in the Editor tab. In addition, while dragging items across the canvas, the user can take advantage of three kinds of ‘snapping’ behavior: to the centers of contours, to the centers of nodes, and to a variable grid.
- LaTeX export. When using LaTeX for typesetting a document, a major advantage of including the document’s diagrams in LaTeX-readable form is that this allows for commands defined elsewhere in the text to be used in the diagrams’ labels. In addition, the font of the labels will automatically match the rest of the document.
- Custom shapes. While each contour initially consists of exactly eight nodes carrying information about the control points of their connecting curves, it is easy to add or delete nodes and to adjust their respective properties. A few examples of how different shapes can be created in this way are described below.
Connectors
To create a connector, select two or more nodes and then click on the Create button (or press Space ), having selected the desired class of connector in the menu immediately above that button.
One thing to note about connectors is that they are implemented as entity nodes that appear as lines or arrows. Whereas normal entity nodes appear as circles, in the case of a connector the circle is usually invisible, and instead the user only sees a line or arrow connecting two nodes. The circle only becomes visible when the user clicks somewhere near the center of that line or arrow.
The reason for this somewhat unusual design is that pasi has originally been developed with the aim of facilitating the creation of diagrammatic languages, in particular ones that make it possible to represent ‘higher-order’ relationships: relationships—i.e., instantiations of relations—that non-trivially involve other relationships. An example would be Iago’s disapproval of Desdemona’s loving Othello:
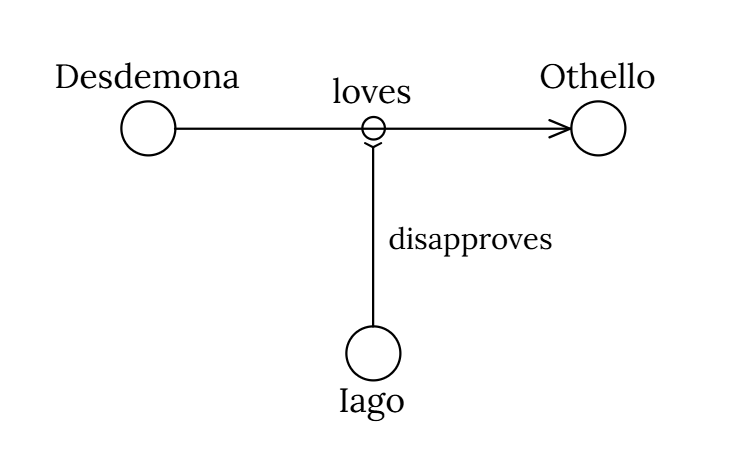
(Click here to load this diagram into the app.) The little circle under ‘loves’, together with the horizontal arrow, represents Desdemona’s loving Othello, while Iago’s disapproval is represented by the vertical arrow (which sports a modified arrowhead). The label ‘disapproves’ is attached to its own little circle, but the latter is here invisible thanks to having had its linewidth set to zero.
Sample file
Here is a sample file that illustrates how TeXdraw code can be used in a LaTeX document:
\documentclass[twoside,12pt,a4paper]{article}

\usepackage[utf8]{inputenc}
\usepackage{texdraw, lipsum}
\usepackage[style=authoryear, backend=biber]{biblatex}

\begin{document}

\title{Sample}

\author{NN}

\maketitle

\section{Introduction}

\lipsum[1] See Figure~\ref{f1}.

\lipsum[11]

\begin{figure}
\begin{center}
\begin{texdraw}%pasiCodecV1
\drawdim pt \setunitscale 0.75
\linewd 1 \move(400 380)\lcir r:12 %E0
\textref h:C v:B \htext(400 394.5){\vphantom{p}Desdemona}%L0{2 U 0}
\linewd 1 \move(600 380)\lcir r:12 %E1
\textref h:C v:B \htext(600 394.5){\vphantom{p}Othello}%L1{2 U 0}
\linewd 1 \move(412 380)\clvec(420 380)(579.6 380)(587.6 380)\move(587.6 380)\lvec(578.3612 383.8268)\move(587.6 380)\lvec(578.3612 376.1732)\linewd 1 \move(499.976 380)\lcir r:5 %A2(0 1){.u7 0 .n 1}
\textref h:C v:B \htext(499.976 387.5){\vphantom{p}loves}%L2{2 U 0}
\linewd 1 \move(500 280)\lcir r:12 %E3
\textref h:C v:T \htext(500 265.5){Iago}%L3{2 U- 0}
\linewd 1 \move(499.9971 292)\clvec(499.9952 300)(499.9806 360.6)(499.978 371.6)\move(499.978 371.6)\lvec(496.4295 373.4461)\move(499.978 371.6)\lvec(503.5256 373.4478)%A4(3 2){5 0 .u 0 3.n 1}
\textref h:L v:C \htext(506.9878 330.675){\small disapproves}%L4{2 0 0}
\end{texdraw}
\end{center}
\caption{\label{f1}A dramatic diagram.
}
\end{figure}

\section{Conclusion}

\lipsum[21-22]

\end{document}
If you are using Overleaf, you will need to select the ‘LaTeX’ compiler in the settings menu—in the top-left corner of the Overleaf editor screen—so as to allow for the processing of PostScript. Something similar holds for users of other systems, such as TeXstudio. (Thanks to Stephan Leuenberger for bringing this to my attention!)
Contour examples
- Regular octagon. To create a regular octagon, you can simply select all the nodes of some eight-node contour and press P ; or, at the bottom of the Editor tab, click on the buttons labeled ‘Defaults’, ‘Equalize central angles’, and ‘Equalize distances from center’, in any order. (To select all the nodes of a given contour, it is normally enough to click on any one of them or near the contour’s center.)
Star of David. For a more complex example (on more than one level), suppose you wish to create two overlapping regular triangles to form a Star of David. The simplest way to do this begins with creating a regular hexagon. Take a standard eight-node contour, delete two of its nodes, and select the remaining six. Then press P to convert these into a regular hexagon.
Next, press R to rotate the hexagon by 30 degrees, so that it stands on one of its vertices. To create the triangles, select any three nodes that together form a regular triangle, and press G . This will cause these nodes to constitute a new triangular contour, while the remaining three will form the second triangle.
- Pentagram. It is also possible to change the order in which contour nodes are connected, which is useful for creating shapes like a pentagram. Start with a regular pentagon, select all its nodes, and then press H to deactivate their membership in the pentagon’s ‘node group’. (You’ll notice that it’s no longer the case that all the nodes get selected whenever you click on any one of them.) Next, by using Shift -click, select them again in the order in which you want them to be connected. Finally, press G to create a new group. In this group, those nodes will be connected in the same order in which they have just been selected.
Swiss cross. Starting from a standard contour, select any four of its eight nodes and press C (for ‘copy’) to turn it into a contour with twelve nodes. Select all of them and press P to create a regular dodecagon. Make sure that the ‘Snap to contour centers’ option (in the default Editor tab) is selected. Place an entity node on the canvas and drag it to the center of the dodecagon.
Next, hold Ctrl and select any one of the four nodes in the NE, SE, SW, and NW corners. Holding Ctrl + Shift , select also the other three (in any order) as well as, lastly, the central entity node. Release the keys and press U to gradually shrink the square of selected nodes. After a few seconds, you’ll have a Swiss cross with a circle in the center. To remove the circle (the entity node), select it and press Delete or Backspace .
Suppose you’re writing a paper in LaTeX and want to make a quick diagram to include in your text.
Here you can do that.
To create a diagram, start by selecting one or (with Shift -click) more locations on the canvas below (if none is visible, you may need to zoom out or increase your screen size), and then click either the Node or the Contour button. To manipulate your diagram, you can drag nodes around, add labels to nodes, connect nodes with arrows, etc. When you’re done, click the Generate button to have the LaTeX code displayed in the text area below the canvas. To use that code in your document, you’ll need Peter Kabal’s TeXdraw package. (See below for a sample file and instructions for Overleaf users.) You can also load diagrams from previously generated code, using the Load button.
Keyboard commands
The following keyboard commands are available for editing the diagram displayed on the canvas. For editing the TeXdraw code in the text area, the usual commands (including Ctrl + Z and Ctrl + Y for ‘undo’ and ‘redo’) are also available. To select a single node out of a group, hold Ctrl pressed while clicking on it.
| Shortcut | Action |
|---|---|
| N | Add entity nodes at selected locations. |
| M | Add contours at selected locations. |
| X | Create abstractions of selected nodes: ‘ghost nodes’ that will transfer their own features onto any nodes they’re dragged onto. |
| C | Create copies of selected items. (This works not just with nodes, but also with labels.) Add new members to an existing group by copying individual members. |
| L | Attach a label to each selected node. |
| Space | Create one or more ‘dependent items’, such as labels or arrows, attached to the currently selected nodes. (Equivalent to clicking the Create button.) |
| Z | Undo. |
| Y | Redo. |
| W , ↑ | Move selection upwards. |
| A , ← | Move selection to the left. |
| S , ↓ | Move selection downwards. |
| D , → | Move selection to the right. |
| 1 | Set movement distance to 0.1 pixels. |
| 2 | Set movement distance to 1 pixel. |
| 3 | Set movement distance to 10 pixels. |
| 4 | Set movement distance to 100 pixels. |
| 5 | Decrease shading by 0.1. |
| 6 | Increase shading by 0.1 (maximum: 1). |
| 7 | Set shading to 0. |
| Shift + 7 | Set shading to 1. |
| 8 | Decrease linewidth by 0.1 pixels. |
| 9 | Increase linewidth by 0.1 pixels (maximum: 32 pixels). |
| 0 | Set linewidth to 0. |
| Shift + 0 | Set linewidth to 1 pixel. |
| F | Flip selection horizontally. |
| V | Flip selection vertically. |
| P | Turn selected contours into regular polygons. |
| Q | Rotate selection counter-clockwise by 45 degrees. |
| Shift + Q | Rotate selection counter-clockwise by 10n degrees, where n ranges from -1 to 2 (default: 0). The value of n can be set by using the keys 1–4. |
| E | Rotate selection clockwise by 45 degrees. |
| Shift + E | Rotate selection clockwise by 10n degrees, where n ranges from -1 to 2 (default: 0). The value of n can be set by using the keys 1–4. |
| R | Rotate selected contours clockwise by 180 / n degrees, where n is the number of nodes in the respective contour. (E.g., a contour with six nodes is rotated by 30 degrees.) |
| U | Decrease the scaling of the selection by 10n percentage points, where n ranges from -1 to 2 (default: 0). The value of 100% corresponds to the size of the selection—as measured by the distances between selected nodes—at the time it was initiated. Scaling is affected by the relevant options listed in the ‘Transform’ tab. |
| I | Increase the scaling of the selection by 10n percentage points, where n ranges from -1 to 2 (default: 0). The value of n can be set by using the keys 1–4. |
| T | Round the location of each selected node to the nearest pixel. |
| G | Create a group that contains, for each selected item, either the item itself or the highest group among those with which the item is connected by a chain of active membership and that are such that all their ‘leaf members’ are among the selected items. (Maximum group level: 32.) |
| H | Deactivate the membership of each selected item or its second-highest ‘active’ group (where applicable) in its currently highest active group. |
| J | Reactivate the membership of each selected item or (where applicable) its highest active group in the next-lowest group. |
| K | Reactivate the membership of each member of each selected item’s highest active group. |
| , | Turn on ‘adding’. In this mode, selecting an item will add it (or its highest active group, where applicable) to the highest active group of the currently focused item. (This mode can be turned off by clicking on the canvas or by turning on ‘dissolve-adding’.) |
| . | Turn on ‘dissolve-adding’. In this mode, selecting a item will add all members of its highest active group (or the item itself, if there is no such group) to the highest active group of the currently focused item. |
| Delete , Backspace | Delete all selected items. |
| Shift + Space | Deselect any currently selected locations on the canvas. |
| Shift + Enter | Generate the TeXdraw code for the current diagram and display it in the text area below the canvas. |
| Ctrl + Enter | (Re)load diagram from the TeXdraw code shown in the text area below the canvas. |
Alternative apps
The following are a few other editors that also export LaTeX code:
- Dia, a desktop application specializing on diagrams, with a wide variety of export options.
- Inkscape, a fully-featured desktop SVG editor, also allows the creation of diagrams.
- Quiver, a powerful web-based editor that specializes on commutative diagrams.
- TpX, another desktop application, superficially similar to Dia.
Basic design features
- Simplicity. A diagram in pasi consists of at most three basic kinds of building block: entity nodes, contour nodes, and ornaments (such as labels). Their placement and other properties completely determine the appearance of a diagram.
- Precision. With the cursor keys (or W , A , S , D ), it is possible to position items to a precision of one-tenth of a pixel. The exact coordinates of an item can be inspected and adjusted in the Editor tab. In addition, while dragging items across the canvas, the user can take advantage of three kinds of ‘snapping’ behavior: to the centers of contours, to the centers of nodes, and to a variable grid.
- LaTeX export. When using LaTeX for typesetting a document, a major advantage of including the document’s diagrams in LaTeX-readable form is that this allows for commands defined elsewhere in the text to be used in the diagrams’ labels. In addition, the font of the labels will automatically match the rest of the document.
- Custom shapes. While each contour initially consists of exactly eight nodes carrying information about the control points of their connecting curves, it is easy to add or delete nodes and to adjust their respective properties. A few examples of how different shapes can be created in this way are described below.
Connectors
To create a connector, select two or more nodes and then click on the Create button (or press Space ), having selected the desired class of connector in the menu immediately above that button.
One thing to note about connectors is that they are implemented as entity nodes that appear as lines or arrows. Whereas normal entity nodes appear as circles, in the case of a connector the circle is usually invisible, and instead the user only sees a line or arrow connecting two nodes. The circle only becomes visible when the user clicks somewhere near the center of that line or arrow.
The reason for this somewhat unusual design is that pasi has originally been developed with the aim of facilitating the creation of diagrammatic languages, in particular ones that make it possible to represent ‘higher-order’ relationships: relationships—i.e., instantiations of relations—that non-trivially involve other relationships. An example would be Iago’s disapproval of Desdemona’s loving Othello:
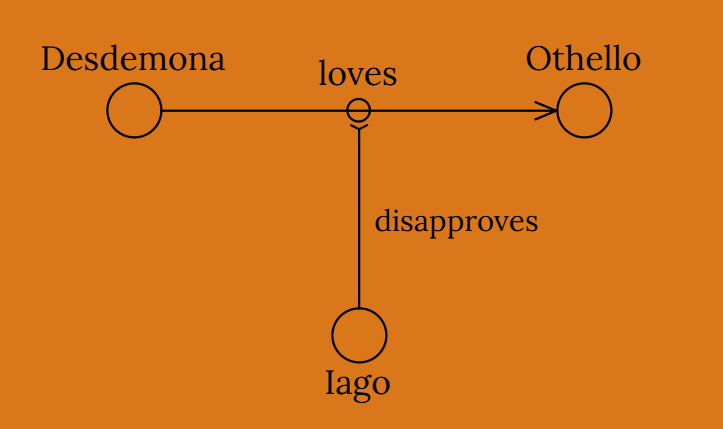
(Click here to load this diagram into the app.) The little circle under ‘loves’, together with the horizontal arrow, represents Desdemona’s loving Othello, while Iago’s disapproval is represented by the vertical arrow (which sports a modified arrowhead). The label ‘disapproves’ is attached to its own little circle, but the latter is here invisible thanks to having had its linewidth set to zero.
Sample file
Here is a sample file that illustrates how TeXdraw code can be used in a LaTeX document:
\documentclass[twoside,12pt,a4paper]{article}

\usepackage[utf8]{inputenc}
\usepackage{texdraw, lipsum}
\usepackage[style=authoryear, backend=biber]{biblatex}

\begin{document}

\title{Sample}

\author{NN}

\maketitle

\section{Introduction}

\lipsum[1] See Figure~\ref{f1}.

\lipsum[11]

\begin{figure}
\begin{center}
\begin{texdraw}%pasiCodecV1
\drawdim pt \setunitscale 0.75
\linewd 1 \move(400 380)\lcir r:12 %E0
\textref h:C v:B \htext(400 394.5){\vphantom{p}Desdemona}%L0{2 U 0}
\linewd 1 \move(600 380)\lcir r:12 %E1
\textref h:C v:B \htext(600 394.5){\vphantom{p}Othello}%L1{2 U 0}
\linewd 1 \move(412 380)\clvec(420 380)(579.6 380)(587.6 380)\move(587.6 380)\lvec(578.3612 383.8268)\move(587.6 380)\lvec(578.3612 376.1732)\linewd 1 \move(499.976 380)\lcir r:5 %A2(0 1){.u7 0 .n 1}
\textref h:C v:B \htext(499.976 387.5){\vphantom{p}loves}%L2{2 U 0}
\linewd 1 \move(500 280)\lcir r:12 %E3
\textref h:C v:T \htext(500 265.5){Iago}%L3{2 U- 0}
\linewd 1 \move(499.9971 292)\clvec(499.9952 300)(499.9806 360.6)(499.978 371.6)\move(499.978 371.6)\lvec(496.4295 373.4461)\move(499.978 371.6)\lvec(503.5256 373.4478)%A4(3 2){5 0 .u 0 3.n 1}
\textref h:L v:C \htext(506.9878 330.675){\small disapproves}%L4{2 0 0}
\end{texdraw}
\end{center}
\caption{\label{f1}A dramatic diagram.
}
\end{figure}

\section{Conclusion}

\lipsum[21-22]

\end{document}
If you are using Overleaf, you will need to select the ‘LaTeX’ compiler in the settings menu—in the top-left corner of the Overleaf editor screen—so as to allow for the processing of PostScript. Something similar holds for users of other systems, such as TeXstudio. (Thanks to Stephan Leuenberger for bringing this to my attention!)
Contour examples
- Regular octagon. To create a regular octagon, you can simply select all the nodes of some eight-node contour and press P ; or, at the bottom of the Editor tab, click on the buttons labeled ‘Defaults’, ‘Equalize central angles’, and ‘Equalize distances from center’, in any order. (To select all the nodes of a given contour, it is normally enough to click on any one of them or near the contour’s center.)
Star of David. For a more complex example (on more than one level), suppose you wish to create two overlapping regular triangles to form a Star of David. The simplest way to do this begins with creating a regular hexagon. Take a standard eight-node contour, delete two of its nodes, and select the remaining six. Then press P to convert these into a regular hexagon.
Next, press R to rotate the hexagon by 30 degrees, so that it stands on one of its vertices. To create the triangles, select any three nodes that together form a regular triangle, and press G . This will cause these nodes to constitute a new triangular contour, while the remaining three will form the second triangle.
- Pentagram. It is also possible to change the order in which contour nodes are connected, which is useful for creating shapes like a pentagram. Start with a regular pentagon, select all its nodes, and then press H to deactivate their membership in the pentagon’s ‘node group’. (You’ll notice that it’s no longer the case that all the nodes get selected whenever you click on any one of them.) Next, by using Shift -click, select them again in the order in which you want them to be connected. Finally, press G to create a new group. In this group, those nodes will be connected in the same order in which they have just been selected.
Swiss cross. Starting from a standard contour, select any four of its eight nodes and press C (for ‘copy’) to turn it into a contour with twelve nodes. Select all of them and press P to create a regular dodecagon. Make sure that the ‘Snap to contour centers’ option (in the default Editor tab) is selected. Place an entity node on the canvas and drag it to the center of the dodecagon.
Next, hold Ctrl and select any one of the four nodes in the NE, SE, SW, and NW corners. Holding Ctrl + Shift , select also the other three (in any order) as well as, lastly, the central entity node. Release the keys and press U to gradually shrink the square of selected nodes. After a few seconds, you’ll have a Swiss cross with a circle in the center. To remove the circle (the entity node), select it and press Delete or Backspace .